
Have you tried to add Uptime Kuma to Grafana? How do they work together?
Let’s find out in this article!
The fusion of Uptime Kuma and Grafana has emerged as a potent solution for ensuring the uninterrupted and efficient operation of critical services.
With the help of these tools, you can gain valuable insights into the health and performance of your systems, and take proactive measures to prevent downtime and minimize disruptions.
In this article, we will explore the synergy of Uptime Kuma with Grafana and their impact together. We will learn how they play a pivotal role in the world of monitoring and analytics.
Monitoring and its various aspects
Monitoring refers to the process of observing and measuring the performance and availability of various components of an IT infrastructure, including servers, applications, networks, and services.

It involves collecting data on key metrics such as response time, uptime, and error rates, and analyzing this data to gain insights into the health and performance of the system.
Here are some of the various aspects of monitoring:
Uptime Monitoring: It tracks the availability of servers, applications, and services in real-time to ensure uninterrupted operations.
It also provides immediate alerts when components or services experience downtime, enabling swift responses from IT teams to minimize disruptions.
Performance Monitoring: It assesses the efficiency of IT infrastructure components, including CPU usage, memory usage, and network bandwidth.
It’s instrumental in pinpointing bottlenecks and issues that impact system performance.
Log Monitoring: This involves collecting and analyzing log data from various IT infrastructure components like servers, applications, and network devices.
It’s essential for identifying errors, security threats, and other issues affecting the system’s stability and security.
The significance of monitoring uptime and performance includes:
1. Ensuring the reliability and availability of IT systems.
2. Preventing downtime.
3. Improving performance.
4. Ensuring compliance.
Challenges of Monitoring in Modern IT Environments
Complexity: Modern IT environments are complex and dynamic, with multiple components and services running on different platforms and locations.
This makes it difficult to get a holistic view of the system and identify issues that may be affecting the performance and availability of the system.
Fragmentation: The monitoring tool landscape is vast, with multiple open-source and commercial tools available for monitoring different aspects of the IT infrastructure.
This can lead to fragmentation of data and make it difficult to get a unified view of the system.
Lack of expertise: New and more junior teams may find modern IT environments overwhelming and may not be trained on how to properly communicate insights from monitoring solutions.
This can lead to a lack of visibility within organizations and make it difficult to identify and address issues promptly.
Introducing Uptime Kuma and Grafana
Uptime Kuma and Grafana are two powerful tools that can be used together to monitor the uptime and performance of IT systems.
Uptime Kuma is an open-source uptime monitoring tool that provides real-time alerts when network components or services go down.
Grafana, on the other hand, is a popular open-source platform for data visualization and monitoring.
When used together, Uptime Kuma and Grafana provide a comprehensive monitoring solution.
Key Features and Functionalities
Uptime Kuma
Real-time alerts: Uptime Kuma provides real-time alerts when network components or services go down, allowing IT teams to respond promptly to minimize downtime.
Multiple monitoring options: Uptime Kuma supports multiple monitoring options, including HTTP, TCP, and keyword monitoring.
Integration with Prometheus: Uptime Kuma can be integrated with Prometheus, a popular open-source monitoring and alerting tool, to provide more advanced monitoring capabilities.
Grafana
Data visualization: Grafana provides powerful data visualization capabilities, allowing IT teams to create custom dashboards and charts to monitor the performance and availability of their systems.
Integration with multiple data sources: Grafana can be integrated with multiple data sources, including Prometheus, Elasticsearch, and InfluxDB, to provide a unified view of the system.
Alerting: Grafana provides alerting capabilities, allowing IT teams to set up alerts based on specific metrics and thresholds.
Benefits of using Uptime Kuma together with Grafana for monitoring
1. Uptime Kuma and Grafana provide a comprehensive monitoring solution that covers both uptime and performance monitoring.
2. Grafana allows IT teams to create custom dashboards and charts to monitor the performance and availability of their systems, providing a more personalized and actionable view of the system.
3. Grafana can be integrated with multiple data sources, allowing IT teams to get a unified view of the system and correlate data from different sources.
4. Uptime Kuma provides real-time alerts when network components or services go down, allowing IT teams to respond promptly to minimize downtime.
5. Both Uptime Kuma and Grafana are open-source tools, which means they are free to use and can be customized to meet specific monitoring needs.
Installation and Setup
Prerequisites or System Requirements
Operating system: Uptime Kuma and Grafana can be installed on Linux, Windows, and macOS.
Docker: If you are installing Uptime Kuma as a Docker container, you need to have Docker installed on your system.
Web browser: You need a modern web browser such as Google Chrome, Mozilla Firefox, or Microsoft Edge to access the Grafana web interface.
System resources: Uptime Kuma and Grafana require a certain amount of system resources to run smoothly. The exact requirements depend on the size and complexity of your IT infrastructure.
Guide on how to install Uptime Kuma on Grafana
1. Download and install the latest version of Grafana from the official website.
2. Install Uptime Kuma by following the instructions provided in the official documentation.
3. Configure Uptime Kuma to monitor your systems by editing the configuration file or using the web interface.
4. In Grafana, go to Configuration > Data Sources and click on “Add data source”.
5. Select “Prometheus” as the data source type and enter the URL of your Uptime Kuma instance.
6. Create a custom dashboard in Grafana to display the monitoring data.
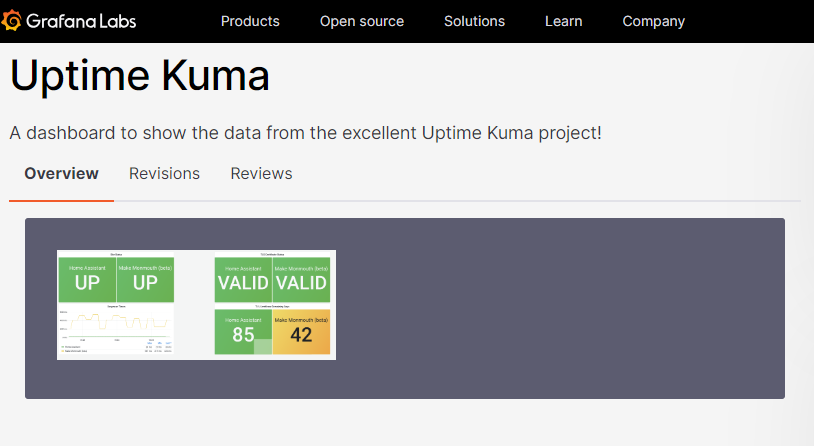
7. You can use the pre-built Uptime Kuma dashboard available on the Grafana website or create your custom dashboard.
Configuring Monitors and Alerts
To set up monitors for various services and resources:
1. Identify the services and resources you want to monitor.
2. Choose a monitoring tool either open-source or commercial.
3. Configure the monitoring tool by setting up monitors for specific metrics, such as response time, uptime, and error rates.
4. Set up alerts by defining alerting thresholds for each monitor to receive notifications when a metric exceeds a certain threshold.
Data Visualization with Grafana
Grafana can be used to visualize the data collected by Uptime Kuma.
It provides powerful data visualization capabilities, allowing IT teams to create custom dashboards and charts to monitor the performance and availability of their systems.

After creating a custom dashboard in Grafana to display the monitoring data during installation, add panels to your dashboard.
The panels assist in displaying the monitoring data. You can add panels for specific metrics, such as response time, uptime, and error rates.
Additionally, customize your dashboard by adding annotations, alerts, and other features to make it more informative and actionable.
Here are some examples of dashboards and panels that can be created in Grafana to monitor Uptime Kuma data:
1. Uptime dashboard.
2. Performance dashboard.
3. Log dashboard.
Troubleshooting and Common Issues
Common problems users may encounter with Uptime Kuma Grafana
Users may encounter difficulty setting up Uptime Kuma. This happens especially if they are not familiar with the configuration process.
Users may encounter issues with data visualization in Grafana, such as incorrect or missing data.
Users may encounter issues with alerting, such as receiving too many false positive alerts or not receiving alerts when issues occur.
Solutions and troubleshooting tips
Difficulty setting up Uptime Kuma: Users can refer to the official documentation for Uptime Kuma and Grafana for guidance on how to set up and configure the tools properly.
They can also seek assistance from the community forums or support channels.
Issues with data visualization: Users can check the data sources and queries used in Grafana to ensure they are correct and up-to-date.
They can also check the logs and metrics generated by Uptime Kuma to identify any issues.
Alerting issues: Users can review the alerting thresholds and settings to ensure they are configured properly.
They can also check the logs and metrics generated by Uptime Kuma to identify any issues.
Conclusion
In summary, Uptime Kuma and Grafana offer a dynamic and adaptable monitoring solution.
That empowers IT teams to extract invaluable insights into system health and performance.
These tools enable swift issue detection, downtime prevention, and regulatory compliance adherence.
To leverage these benefits, implement robust security measures and follow best practices to safeguard monitoring systems and sensitive data against cyber threats.
By embracing this comprehensive monitoring solution, organizations can bolster the reliability and availability of their IT systems.